Statistics can feel like a wall of formulas and dry definitions — or it can feel like playing with a well-designed set of toys that slowly reveal how randomness behaves. Seeing Theory takes the latter approach: an exquisitely simple, interactive, visual introduction to probability and statistics created as an undergraduate project that grew into a widely used teaching resource. It’s built around short lessons, bite-sized visuals, and live manipulatives that invite you to experiment rather than memorize.
What Seeing Theory is
At its core, Seeing Theory is a website whose goal is to make foundational ideas in probability and statistics accessible through interactive visualizations. It covers the arc from basic probability through compound probability, distributions, frequentist and Bayesian inference, and regression analysis — each chapter split into focused topics like chance events, expectation, variance, Bayes’ theorem, the central limit theorem, ordinary least squares, and more. The material is intentionally concise and motivated by visuals that respond in real time as you change parameters.
Why this works pedagogically: people learn probability best when they can see randomness evolve. Watching a running sample mean approach the expected value, or dragging a prior and seeing the posterior update, turns abstract definitions into tangible intuition. The interactivity invites exploration — “what happens if I bias the coin?” or “how does sample size change the width of a confidence interval?” — which is exactly how understanding deepens.
The experience — chapter by chapter
Below I summarize the main chapters and the kinds of activities you’ll encounter, with practical notes for readers who want to use the site for self-study or teaching.
1) Basic Probability
Focuses on chance events, expectation, and variance. Typical interactives:
- Flip a coin many times and watch the empirical frequency of heads converge (or waver) toward the theoretical probability.
- Roll dice with adjustable face probabilities and see the running sample mean approach the expectation.
- Draw cards from a custom deck to visualize variance as the running average of squared deviations.
These small experiments build intuition about long-run frequency, the meaning of expectation, and what variance measures.
2) Compound Probability
Covers set theory, counting, and conditional probability. You’ll see Venn-diagram-style visuals, counting tools that break down combinatorics into visual blocks, and conditional sliders that reveal how information changes probabilities.
3) Probability Distributions
Introduces discrete and continuous distributions and culminates in a visual, hands-on proof of the Central Limit Theorem: watch how sums of many independent variables approach a bell-shaped curve even when the original variables are not bell-shaped.
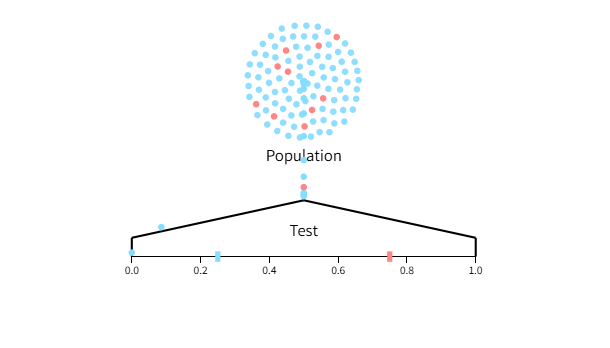
4) Frequentist Inference
Explains estimation and interval estimation. The site makes confidence intervals tangible by simulating repeated experiments and showing how often intervals contain the true value. The bootstrap is also presented with animations that show resampling in action.
5) Bayesian Inference
Probably the most “magical” chapter for first-timers: you can drag priors, see the likelihood update, and watch priors become posteriors. This demystifies Bayes’ theorem with hands-on cause-and-effect visuals rather than purely symbolic algebra.
6) Regression Analysis
Covers ordinary least squares, correlation, and ANOVA with interactive scatterplots where you can add noise, change slope, or filter points to directly observe effects on estimates and fit quality.
Across chapters the visualizations are implemented using D3.js (a popular JavaScript visualization library), and the site encourages exploration — tweak parameters, rerun simulations, and watch mathematics unfold.
Who will benefit
- Beginners: Clear, gradual exposition makes foundational ideas less intimidating.
- Students in intro stats: Visual complements to lecture notes — great for homework prep and exam intuition.
- Instructors: Ready-made demos for live classes; use the simulations to turn passive lecture time into an interactive lab.
- Self-learners & curious minds: The site is excellent for building mental models without heavy prerequisites.
If you’re an instructor or tutor, here are a few quick lesson ideas:
- Exploration lab: Assign a chapter and ask students to screenshot three different parameter settings and write short observations about each.
- Prediction-first activity: Before running a simulation (e.g., the coin-flip convergence), have students predict outcomes, then run the demo and reflect on surprises.
- Mini-project: Ask students to design an experiment on the site (e.g., biased die + bootstrap interval) and report what the visuals show about sampling variability.
- Bayes in practice: Use the Bayesian chapter to compare weak vs. strong priors on the same data and discuss when prior information helps or hurts.
Strengths, artifacts, and a note on the archive status
Strengths:
- Clarity: Short, focused pages that emphasize intuition.
- Interactive learning: Visuals that respond instantly to user inputs.
- Modular: Each topic stands alone, so learners can pick exactly what they need.
Limitations / things to know:
- The site is currently archived for reference; it still works as an educational resource but the “living” development has slowed and—for heavy classroom adoption—check for the most current textbook drafts referenced on the site. The authors have also made a draft textbook available for download and invited feedback.
Behind the scenes & credibility
Seeing Theory was created by Daniel Kunin while he was an undergraduate at Brown University and developed with a small team of collaborators. The project uses D3.js for the visualizations and has earned recognition and press (awards and features in design and academic outlets), which is part of why it’s widely used in classrooms and referenced by learners. There’s also an active effort behind the scenes to convert these materials into a textbook draft that educators and learners can download and comment on.
Probability becomes human when we can see surprise, variability, and convergence. Seeing Theory doesn’t just tell you what a law or theorem says — it hands you the knobs and asks you to try it yourself. That transforms abstract rules into lived experience: you start to feel why large samples stabilize, why variance matters, and why priors shape conclusions. For learners and teachers who prefer exploration to rote memorization, the site is a warm, generous classroom in your browser. Give it a spin — tweak a slider, run a hundred coin flips, and notice how intuition grows one visualization at a time.
Ads-Click the below link to buy the T-Shirt